Late-Discovered Operational Risk Events
How much loss has already happened but not yet been recorded?
NoteRead this first
Everything here comes from a simulation with assumed parameters, not from any firm’s data. It tests how reserving methods behave when the true answer is known. It does not estimate any real firm’s losses.
The question
Operational losses such as trade errors, NAV pricing errors and unauthorized trading are often found long after they happen, and the loss database records them when they are found. So recent periods look cleaner than they are. This is the actuarial incurred-but-not-reported (IBNR) problem, and run-off triangles, analysed with the ChainLadder R package, are a natural way to estimate what is missing. Losses are booked in full when discovered, so this is a pure IBNR problem: it does not model later development on events already known (provisions, recoveries, insurance; see Limitations).
What we found (under the assumed generator)
Recent reported losses understate the truth, a lot for slow-to-detect events. For the latest four quarters, the share of true incurred loss not yet in the database averages 11% for trade errors, 59% for NAV errors and 87% for unauthorized trading. For unauthorized trading the typical (median) database has 100% of that loss still unrecorded, so in a typical year none of it has been found yet. (pictures below)
Standard methods work only where events are plentiful. Mack and bootstrap chain-ladder are close to unbiased for trade errors (1% and 2% relative bias) and acceptable for NAV errors (10% for Mack). Their 95% intervals are somewhat too narrow: Mack covers the truth 94% of the time for trade errors and 92% for NAV errors, while bootstrap covers 86% and 90%. (Results)
For rare, heavy-tailed unauthorized trading, the standard package implementations mostly cannot run. Mack was usable in 0 of 200 databases. That is a limit of the
MackChainLadder()implementation on triangles with empty development columns. Setting those factors to 1 makes Mack run (200 of 200), but its relative bias is 866%, its median error -42% and its interval coverage 43%; Bornhuetter-Ferguson with an external development pattern is better in the median (14%) but has no interval and is unstable in the mean. A frequency x severity approach gives a usable estimate (relative bias -4%) but its 95% intervals cover only 63%. Only 2.7% of unauthorized-trading events are discovered after the 10-year window, yet they carry about 40% of the true undiscovered loss, because loss grows while an event stays hidden (up to 4.2 times the initial size at lag 40). (Results)A control improvement fools development methods. If detection gets faster, methods trained on the slower past keep predicting development that no longer occurs. After the improvement, Mack’s mean estimate of undiscovered loss is $153.4K for trade errors against a true $94.46K, and $3.1M for NAV errors against a true $1.6M. Restricting the development factors to the latest three diagonals removes most of the trade-error gap. (Results)
Faster detection mainly buys earlier information; the dollar savings rest on one assumption. Expected annual loss is $6.0M (12 bps of a $5B firm). The two example controls save $502.30K and $735.12K a year against assumed costs of $400.0K and $700.0K: close to break-even on the mean, with 95% expected shortfall falling from $31.8M to $26.8M and $23.4M (the reduction under reconciliation automation has a paired 95% bootstrap interval of $3.0M to $7.4M). Both the mean and the tail savings exist only because simulated losses grow while undiscovered (0.02 to 0.08 per quarter in this model); with no growth both vanish. What remains is earlier information: undiscovered loss at year 10 falls from $12.6M to $6.3M and $4.5M. (Control value)
What this means for a COO or CRO (conditional on the above)
- Treat the most recent year of loss data for slow-detection event types as incomplete, and say so when reporting trends.
- Do not apply a standard development method blindly to rare, large-loss events; use a frequency-severity view and an explicit tail assumption.
- Judge a detection control by how much of its promised lag reduction it must deliver to break even, not by a single point ROI.
- Check how your loss data feeds capital and compensation. For banks, the Basel III Standardised Approach (SMA) builds its Loss Component from about ten years of internal loss data, so late-discovered losses enter by date of accounting and the latest years understate exposure. For asset managers, NAV-error compensation is recognised when the error is found, so the most recent loss trend understates exposure in the same way. Confirm the exact treatment against your own regulator’s rules.
Which method for which event type
| Event type | What the tests support | Not supported |
|---|---|---|
| Trade errors | Mack or bootstrap chain-ladder; treat intervals as slightly narrow | Clark curves (degenerate fits; see Results) |
| NAV errors | Mack, with bootstrap or Bornhuetter-Ferguson as a cross-check; Clark Cape Cod also scores well here but fails badly on trade errors | Reading intervals as exact 95% |
| Unauthorized trading | Frequency x severity plus an explicit tail assumption, reported with a wide caveat | Standard package chain-ladder (no usable fits); Exposure-based methods such as Bornhuetter-Ferguson are not yet tested here |
To use this on real data you would replace each assumed parameter as listed under Limitations; the Reproducibility page shows how to rebuild everything.
The problem in pictures
Why recent periods look clean
A loss event database is organised by when an event was discovered, not when it happened. A trade error booked on Monday may be found by reconciliation the same week. A mispriced NAV may surface a year later. An unauthorized position can run for several years.
So at any evaluation date, the most recent origin periods have had the least time to be discovered. Their recorded losses are low because the events have not yet been found, not necessarily because controls improved. This is the same structure as incurred-but-not-reported (IBNR) claims in insurance reserving, and a run-off triangle is the natural way to see it.
One synthetic database, as a triangle
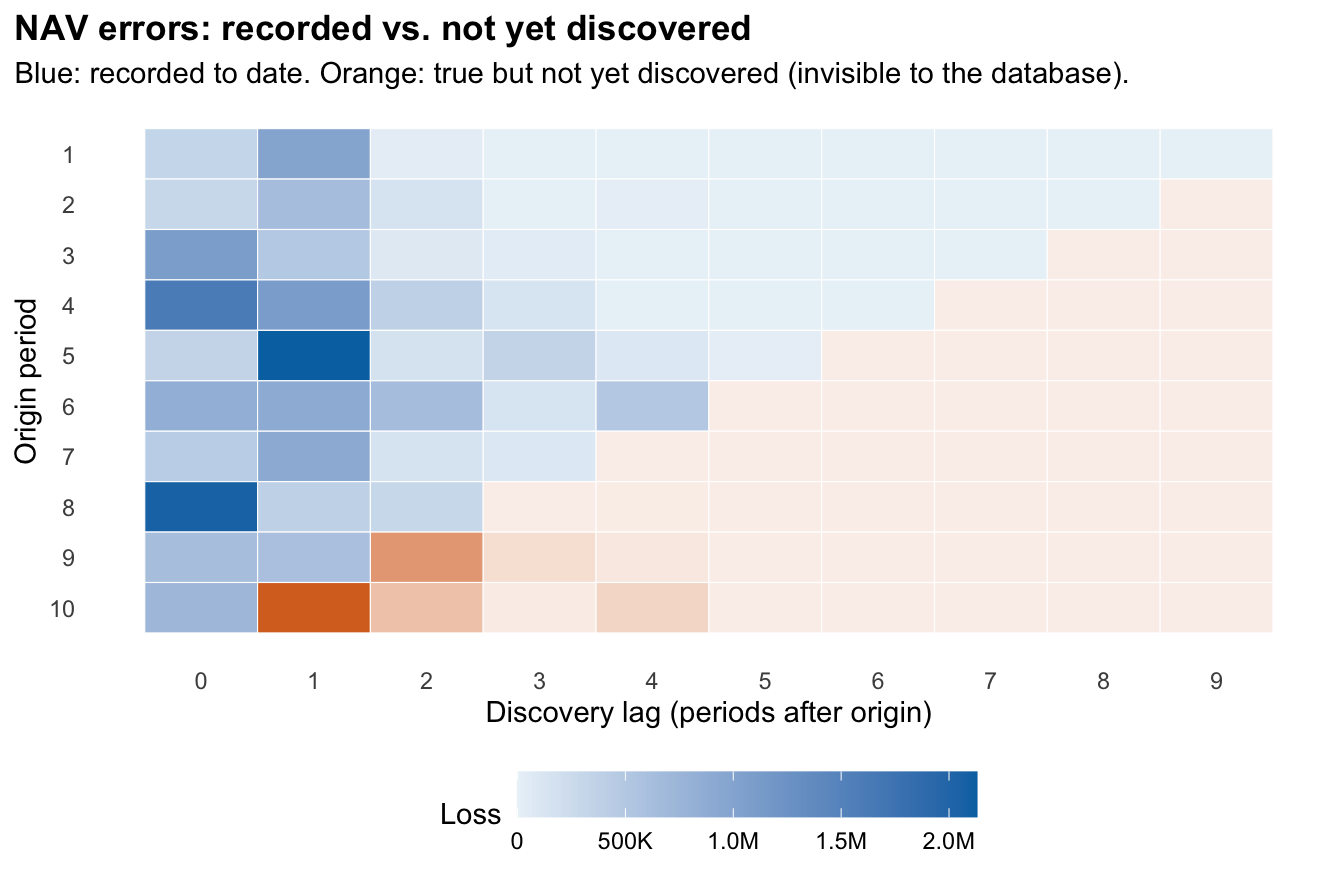
Rows are origin periods (years), columns are discovery lags (years after origin). A cell holds the loss from events that originated in that row and were discovered that many years later. The database can only fill the upper-left; the lower-right (orange) is real loss that exists but has not been discovered.
How to read the plot
Each row is a year in which errors happened, and each column is how many years later they were found. Blue boxes are losses already found and recorded, with darker blue meaning a larger loss. Orange boxes are real losses that exist but have not been found yet, which we can show only because the data are simulated.
What the plot tells you
The most recent years (bottom rows) are mostly unfilled because their losses have not had time to surface, so they look cleaner than they are. Loss can also arrive a year or more late: the biggest orange box is year 10’s losses expected to be found one year later.
The artifact: reported losses fall, true losses do not
How to read the plot.
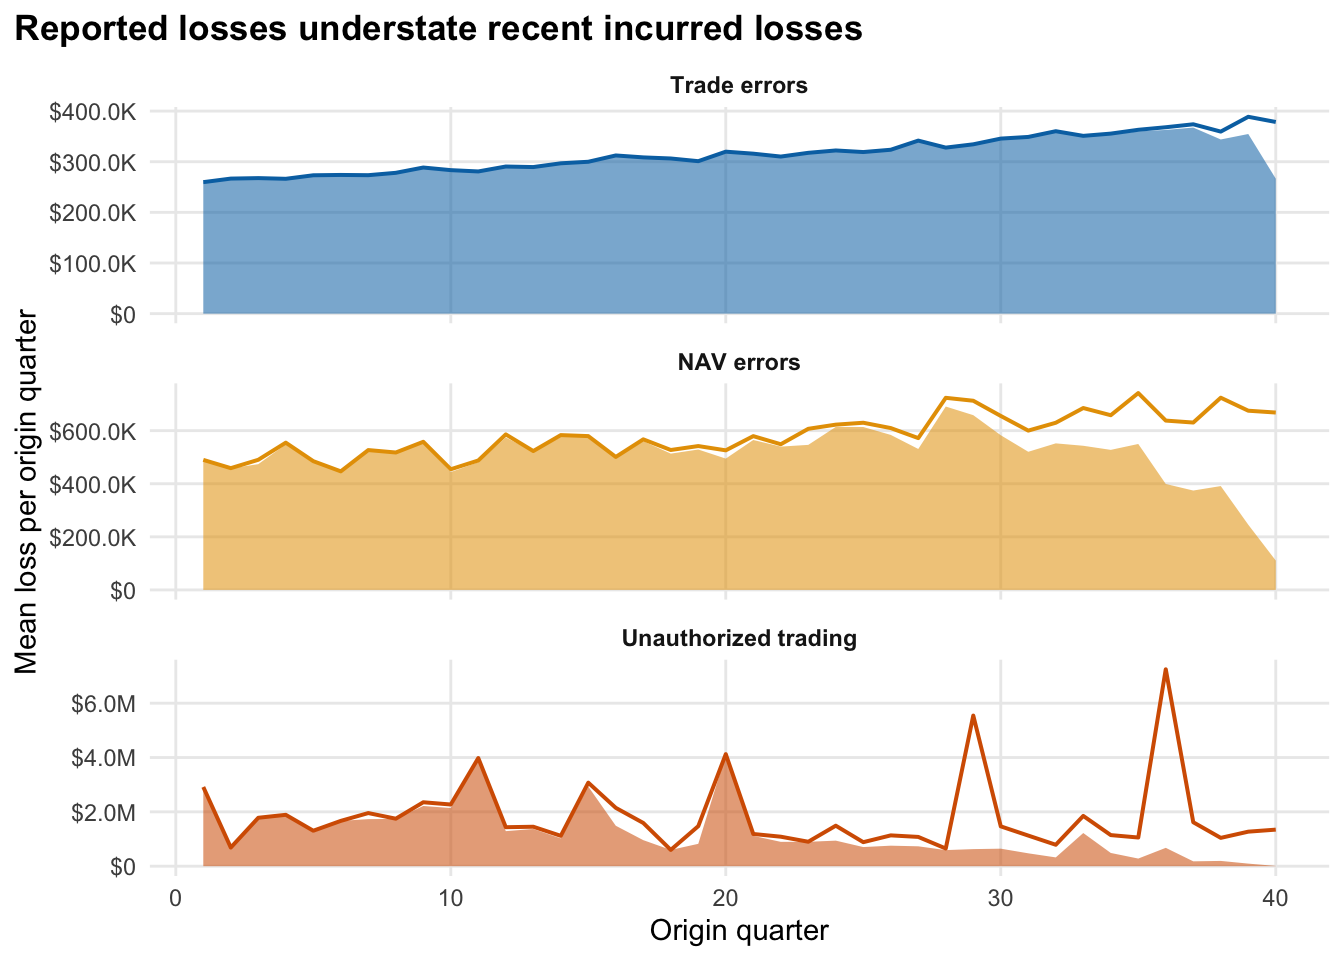
For each event type, the line is the true loss that actually happened in each quarter, and the shaded area is the part of it the database has recorded by the end of quarter 40. Where the shading falls below the line, loss has occurred but is not yet visible.
What the plot tells you.
Recorded loss drops away in the most recent quarters while true loss does not, so a falling trend in recent reports can be an artifact of late discovery and not a real improvement. For the latest four origin quarters in the baseline scenario, the share of true incurred loss that is not yet in the database averages 11% for trade errors, 59% for NAV errors and 87% for unauthorized trading.
For unauthorized trading the typical (median) database has 100% of that loss still unrecorded, and its largest losses, the spikes in the chart, are often not yet visible at all. These shares depend on the assumed lag distributions (see Synthetic Data); they illustrate the mechanism, not any real firm.
What the rest of the site tests
If the missing amount can be estimated from the shape of past development, a firm can correct its recent loss figures and size a reserve-like buffer. The question we test is which estimation methods are trustworthy for which event type, using synthetic data where the true answer is known.