ord <- ms |> arrange(mean) |> pull(strategy)
d <- ms |>
  select(strategy, mean, p95) |>
  left_join(base |> select(strategy, loss_rational), by = "strategy") |>
  mutate(y = match(strategy, rev(ord)))            # numeric row position, best on top
bar_h <- 0.34
ggplot(d) +
  # light bar: crew read perfectly (upper half of each row)
  geom_rect(aes(xmin = 0, xmax = loss_rational, ymin = y + 0.02, ymax = y + 0.02 + bar_h,
                fill = strategy), alpha = 0.4) +
  # dark bar: crew misjudged (lower half of each row)
  geom_rect(aes(xmin = 0, xmax = mean, ymin = y - 0.02 - bar_h, ymax = y - 0.02,
                fill = strategy)) +
  # whisker from the misjudged mean to the 95th percentile
  geom_segment(aes(x = mean, xend = p95, y = y - 0.02 - bar_h / 2, yend = y - 0.02 - bar_h / 2),
               color = "gray25", linewidth = 0.5) +
  geom_segment(aes(x = p95, xend = p95, y = y - 0.02 - bar_h * 0.85, yend = y - 0.02 - bar_h * 0.15),
               color = "gray25", linewidth = 0.5) +
  # labels
  geom_text(aes(x = loss_rational, y = y + 0.02 + bar_h / 2, label = fmt_m(loss_rational)),
            hjust = -0.15, size = 3.4, color = "gray20") +
  geom_text(aes(x = mean, y = y - 0.02 - bar_h / 2, label = fmt_m(mean),
                color = strategy == "uniform"),               # dark text on the pale bar
            hjust = 1.15, size = 3.4, fontface = "bold") +
  scale_color_manual(values = c(`TRUE` = "gray15", `FALSE` = "white"), guide = "none") +
  geom_text(aes(x = p95, y = y - 0.02 - bar_h / 2, label = paste0("1-in-20: ", fmt_m(p95))),
            hjust = -0.1, size = 3.1, color = "gray30") +
  scale_fill_manual(values = STRAT_COLS, guide = "none") +
  scale_y_continuous(breaks = d$y, labels = STRAT_LABELS[d$strategy], expand = expansion(add = 0.3)) +
  scale_x_continuous(labels = scales::label_dollar(suffix = "M"),
                     limits = c(0, max(d$p95) * 1.28), expand = expansion(mult = c(0, 0))) +
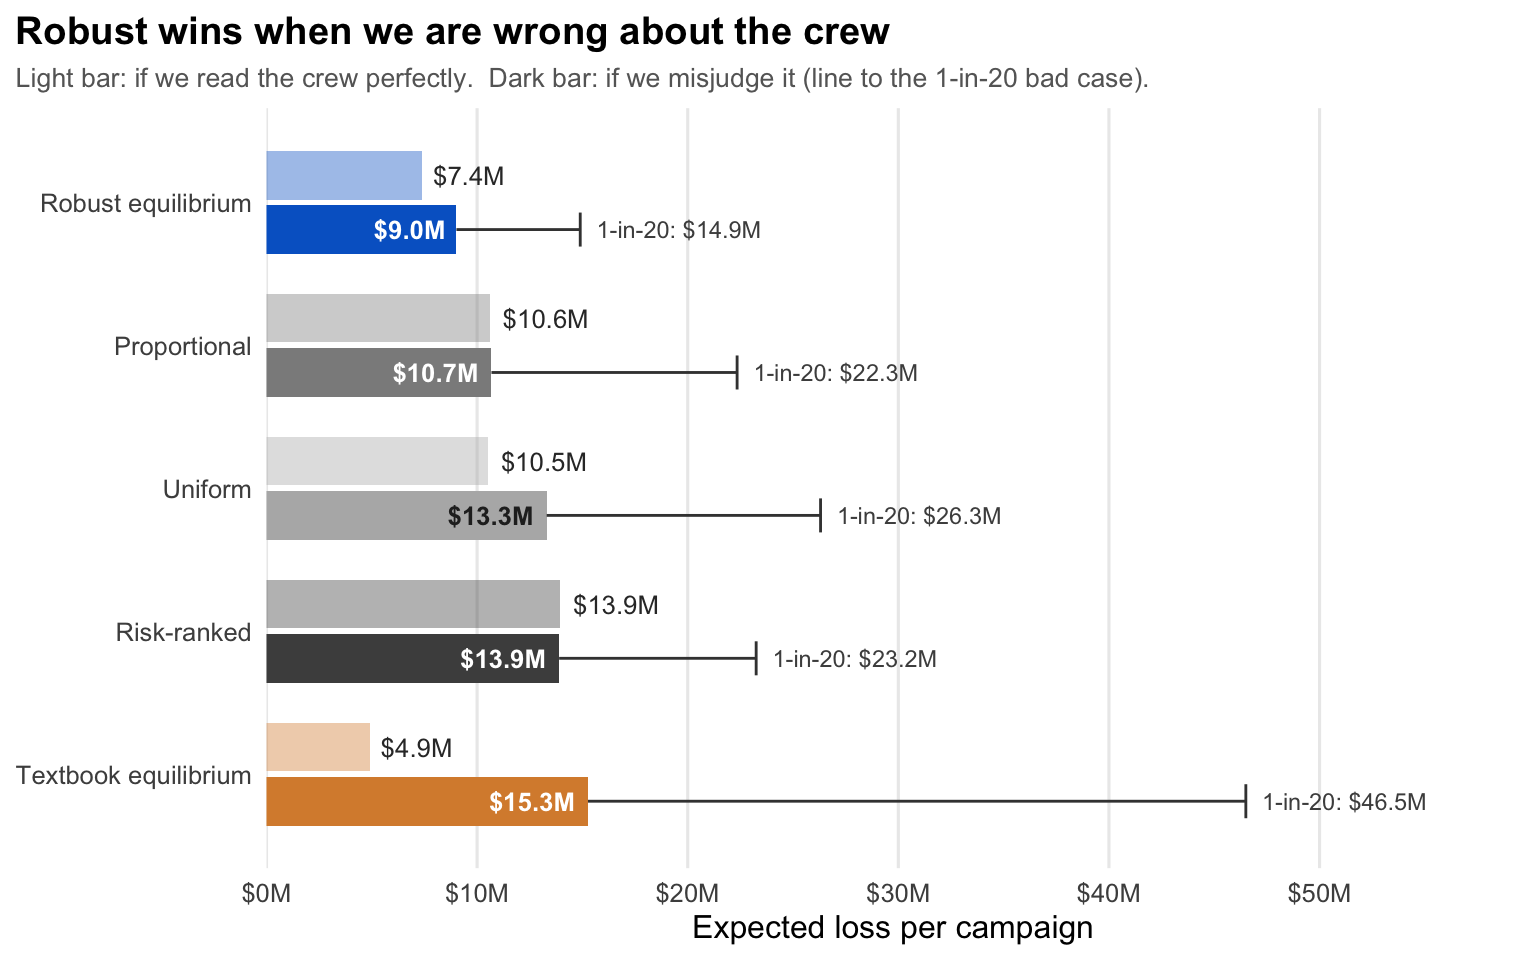
  labs(x = "Expected loss per campaign", y = NULL,
       title = "Robust wins when we are wrong about the crew",
       subtitle = "Light bar: if we read the crew perfectly.  Dark bar: if we misjudge it (line to the 1-in-20 bad case).") +
  theme(panel.grid.major.y = element_blank(), panel.grid.minor = element_blank(),
        plot.subtitle = element_text(size = 10))