Where Will the Attacker Strike?

Game-Theoretic Allocation of a Security Budget: Executive Summary

All money is in $M. Losses are expected loss per targeted ransomware campaign, and the model assumes one campaign per year. All values are illustrative and synthetic.

The problem

Most security budgets are ranked: list the risks, fund from the top. That treats the attacker as weather. Ransomware crews adapt. They look at what we defend and go where the payoff is best for them.

We study a 500-person fintech firm whose cloud platform is critical infrastructure for its clients. It splits $9.0M a year across six assets, and a ransomware crew picks one to hit. We compare five ways to split the money.

Three findings

  1. Risk-ranking invites the attack. Funding the top risks first leaves identity at baseline coverage, and the crew goes there. If we read the crew perfectly, expected loss is $13.9M against $7.4M for the robust allocation; if we misjudge it, $13.9M against $9.0M.

  2. The textbook equilibrium looks best on paper and is worst under uncertainty. If we read the crew perfectly, it cuts loss to $4.9M. If we misjudge the crew modestly, the 95th percentile loss is $46.5M.

  3. The robust allocation anticipates the attacker without betting on a perfect read. It cuts expected loss by 35% and the tail by 36% against risk-ranked.

Code
ord <- ms |> arrange(mean) |> pull(strategy)
d <- ms |>
  select(strategy, mean, p95) |>
  left_join(base |> select(strategy, loss_rational), by = "strategy") |>
  mutate(y = match(strategy, rev(ord)))            # numeric row position, best on top
bar_h <- 0.34
ggplot(d) +
  # light bar: crew read perfectly (upper half of each row)
  geom_rect(aes(xmin = 0, xmax = loss_rational, ymin = y + 0.02, ymax = y + 0.02 + bar_h,
                fill = strategy), alpha = 0.4) +
  # dark bar: crew misjudged (lower half of each row)
  geom_rect(aes(xmin = 0, xmax = mean, ymin = y - 0.02 - bar_h, ymax = y - 0.02,
                fill = strategy)) +
  # whisker from the misjudged mean to the 95th percentile
  geom_segment(aes(x = mean, xend = p95, y = y - 0.02 - bar_h / 2, yend = y - 0.02 - bar_h / 2),
               color = "gray25", linewidth = 0.5) +
  geom_segment(aes(x = p95, xend = p95, y = y - 0.02 - bar_h * 0.85, yend = y - 0.02 - bar_h * 0.15),
               color = "gray25", linewidth = 0.5) +
  # labels
  geom_text(aes(x = loss_rational, y = y + 0.02 + bar_h / 2, label = fmt_m(loss_rational)),
            hjust = -0.15, size = 3.4, color = "gray20") +
  geom_text(aes(x = mean, y = y - 0.02 - bar_h / 2, label = fmt_m(mean),
                color = strategy == "uniform"),               # dark text on the pale bar
            hjust = 1.15, size = 3.4, fontface = "bold") +
  scale_color_manual(values = c(`TRUE` = "gray15", `FALSE` = "white"), guide = "none") +
  geom_text(aes(x = p95, y = y - 0.02 - bar_h / 2, label = paste0("1-in-20: ", fmt_m(p95))),
            hjust = -0.1, size = 3.1, color = "gray30") +
  scale_fill_manual(values = STRAT_COLS, guide = "none") +
  scale_y_continuous(breaks = d$y, labels = STRAT_LABELS[d$strategy], expand = expansion(add = 0.3)) +
  scale_x_continuous(labels = scales::label_dollar(suffix = "M"),
                     limits = c(0, max(d$p95) * 1.28), expand = expansion(mult = c(0, 0))) +
  labs(x = "Expected loss per campaign", y = NULL,
       title = "Robust wins when we are wrong about the crew",
       subtitle = "Light bar: if we read the crew perfectly.  Dark bar: if we misjudge it (line to the 1-in-20 bad case).") +
  theme(panel.grid.major.y = element_blank(), panel.grid.minor = element_blank(),
        plot.subtitle = element_text(size = 10))
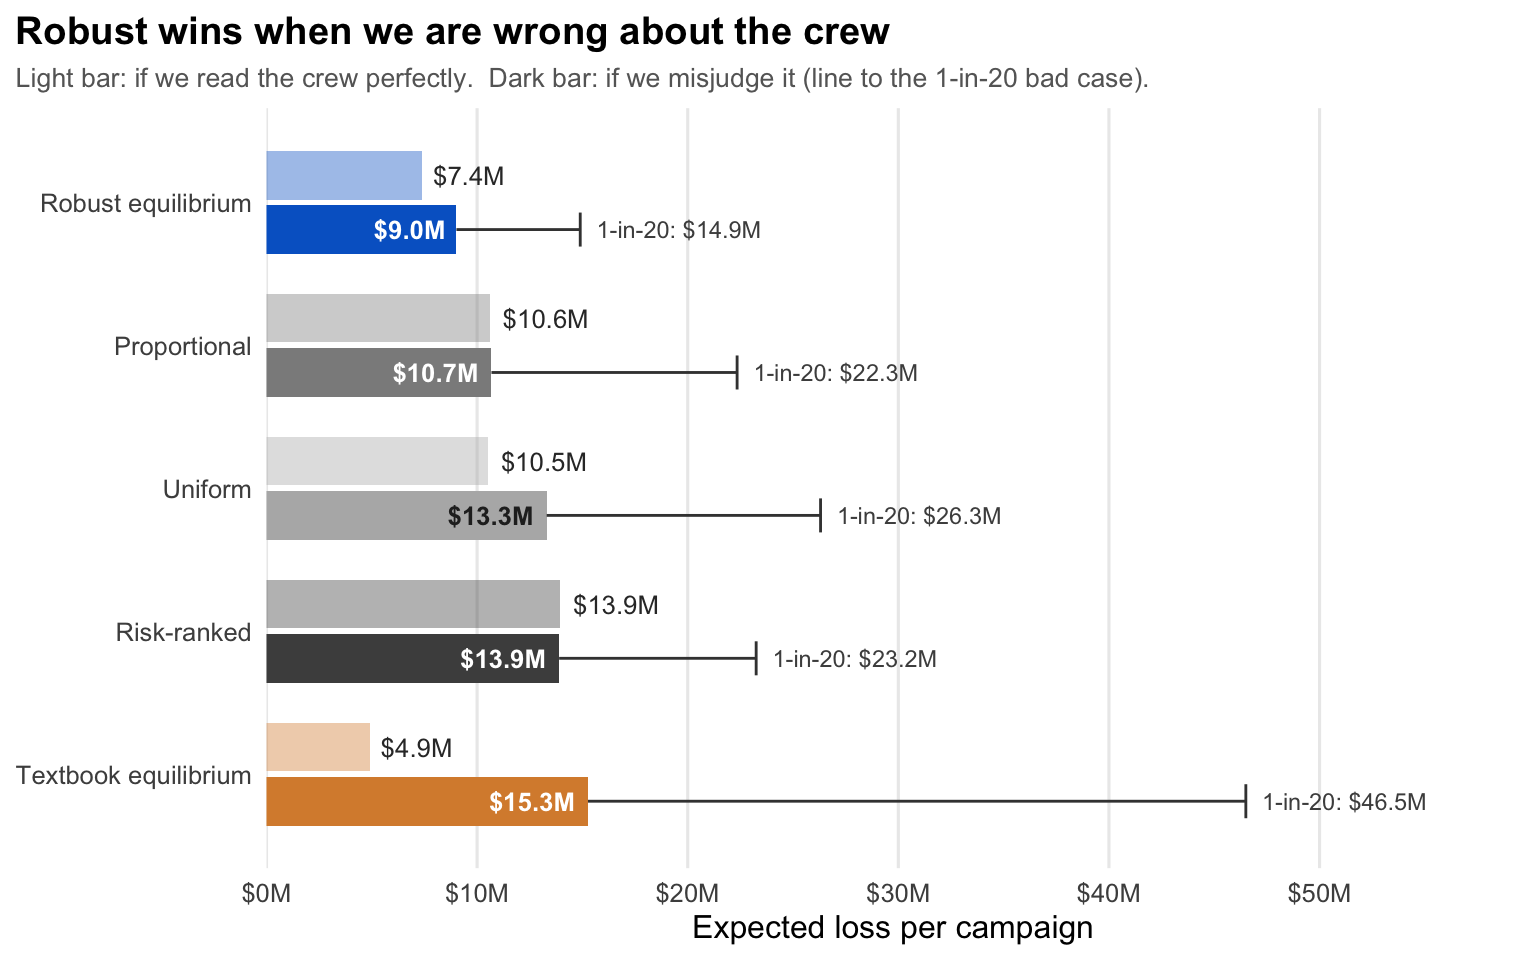
Paired horizontal bars for five strategies, ordered by loss under misjudgment. Robust has the lowest misjudged loss at 9.0 million dollars with a 1-in-20 bad case of 14.9 million. The textbook equilibrium has the lowest loss if read perfectly, 4.9 million, but the highest under misjudgment, 15.3 million, with a 1-in-20 bad case of 46.5 million.
Figure 1: Expected loss per campaign by strategy, if we read the crew perfectly and if we misjudge it. The line runs to the 1-in-20 bad case.

How to read the plot. For each strategy, the light bar is our loss if we read the crew perfectly; the dark bar is our average loss if we misjudge it, and the line runs to the 1-in-20 bad case.

What the plot tells you. The textbook equilibrium has the lowest light bar and the highest dark bar: it is cheapest on paper and costliest when wrong. The robust strategy gives up some of the paper saving and has the lowest average and the shortest line.

NoteQuestions to ask your CISO
  1. Where does our current plan push an attacker?
  2. Which high-impact assets are we under-protecting because we assume attackers don’t want them?
  3. How would our allocation perform if our threat intelligence is wrong?
  4. What does the next $1M buy under each approach?

How to read this site

  • The Game: a two-asset example shows why defending the biggest asset can fail.
  • Allocation: the firm, the six assets and four ways to split the budget.
  • Robustness: what happens when we misjudge the crew, and the robust strategy.
  • Governance: the assumptions, the limits and the automated checks.