Question 3: Would Its Headline Finding Survive a Push?
Author
Patrick Lefler
Published
October 22, 2026
The question
NorthPoint built its own logistic regression, the bank’s incident-association model, from its panel. Its headline: vendors without a current SOC 2 Type II report have about twice the odds of an incident (odds ratio 2.04, vendor-clustered 95% interval 1.48 to 2.82). That finding now supports a contract policy. How small a change makes it disappear?
Method in brief
Pre-registered definition of a “kill”: the no-SOC-2 coefficient loses statistical significance at the 5% level using vendor-clustered standard errors (sandwich::vcovCL, Wald z). Ordinary standard errors ignore within-vendor dependence and may overstate precision.
A specification curve re-estimates the odds ratio across 16 logit models (so every estimate is an odds ratio): include or omit vendor size, prior incidents and financial health, with or without trimming the slowest 1% of patch latencies. A greedy deletion search then removes, one at a time, the incident rows that most support the estimate, from the analysis dataset only; recorded lagged history is kept. Both are bounded searches, not proofs of what is smallest.
The falsifyr package supplies the refits and a supplementary within-model attack run.1
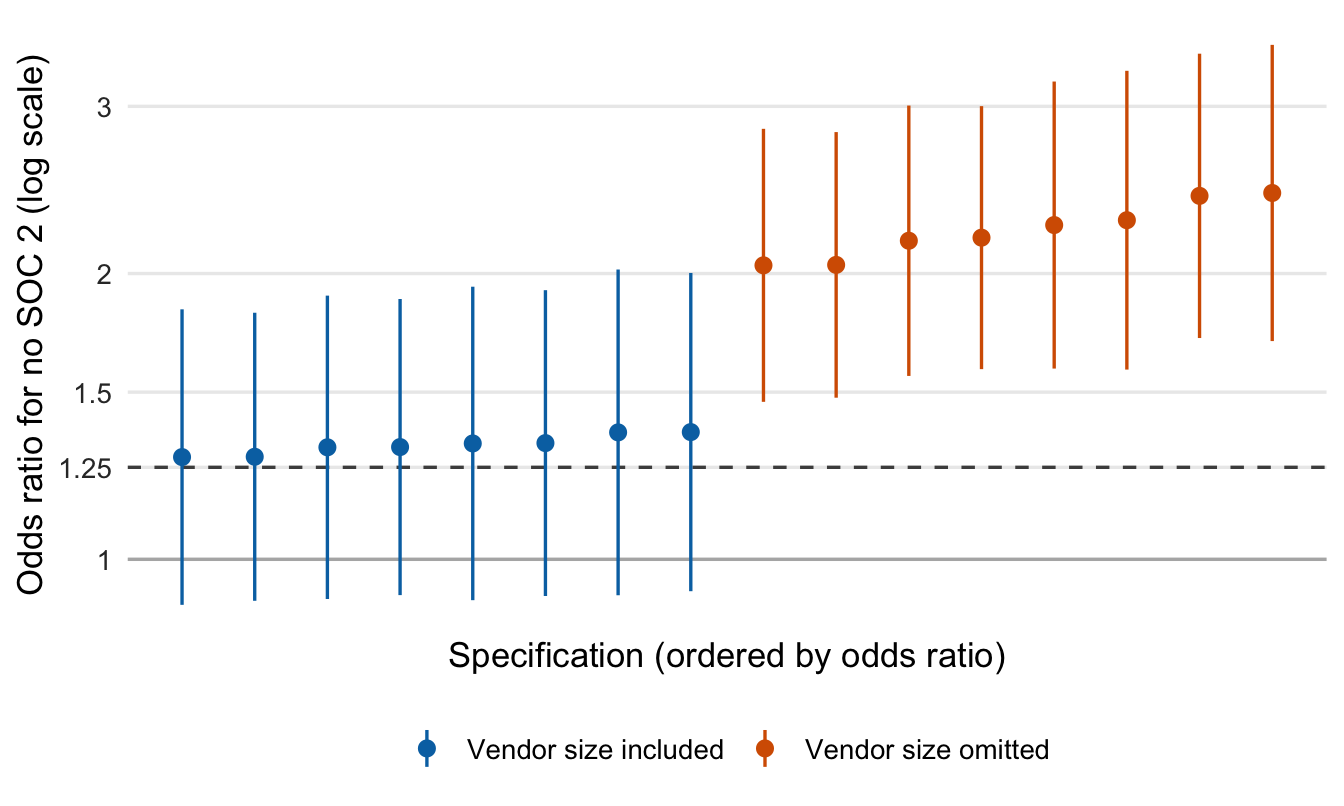
Figure 1: No-SOC-2 odds ratio across 16 logit specifications, ordered by size, with 95% vendor-clustered intervals. Dashed line: data-generating conditional OR, 1.25.
How to read the plot. Each dot is one reasonable way of building the model; height is the estimated increase in the odds of an incident for vendors without SOC 2, and 1 means no effect. The vertical line is the plausible range. The dashed line is the generator’s conditional odds ratio, known because the data are simulated.
What the plot tells you. The dots form two groups, split by one decision: vendor size. Larger vendors are more likely to hold SOC 2 and are safer, so leaving size out credits SOC 2 with that safety. Closeness to 1.25 does not prove a causal model has been recovered.
All 8 specifications without vendor size are significant (odds ratios 2.04 to 2.43); none of the 8 that include it is (1.28 to 1.36). Adding vendor size alone takes the estimate to 1.28 (interval 0.90 to 1.82, p = 0.163) with no data removed. This concerns the association; it does not show that SOC 2 has no effect.
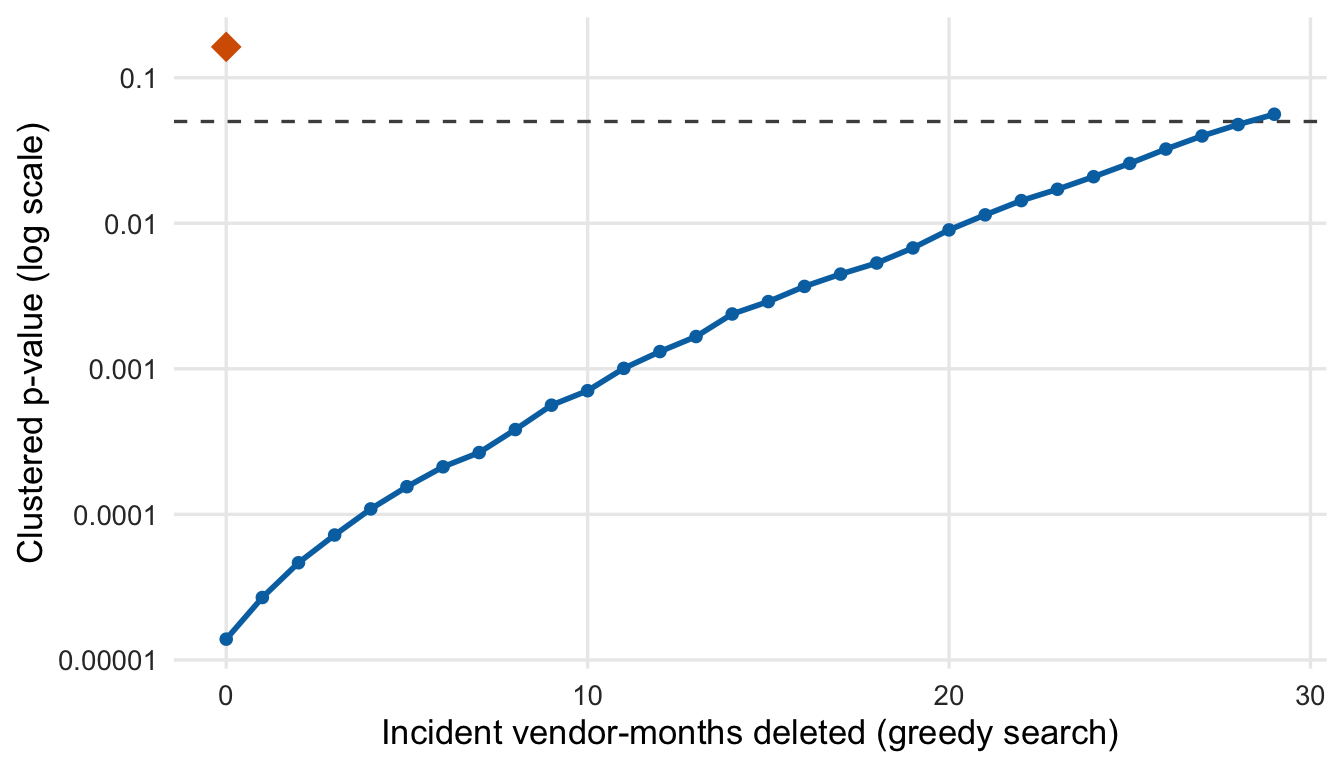
Figure 2: Greedy deletion search: clustered p-value as supportive incident rows are deleted. The diamond is the size-adjusted model with nothing deleted.
How to read the plot. The blue line removes, one at a time, incidents at vendors without SOC 2 that most support the finding, and tracks how convincing the result stays. Higher means weaker evidence; above the dashed line it is no longer statistically significant. The diamond is the size-adjusted result, with no rows removed.
What the plot tells you. This is an adversarial stress test, not data cleaning. The two routes to the 5% line are different kinds of distance, so they should not be compared by counting.
The search found a successful perturbation, within its budget of 80 deletions, at 29 deleted rows: 0.20% of all 14,400 rows, 13.9% of all 209 incidents and 20.6% of the 141 eligible supportive incidents. A greedy search gives an upper bound on the smallest such change, and post-search p-values are diagnostics, not fresh tests. falsifyr found no kill in its run (verdict resilient), which is not proof of robustness.
Seed sensitivity. Each seed generates a different synthetic dataset, so this is a Monte Carlo repeatability check, not a perturbation of the bank’s data. We re-ran the generator for seeds 1 to 40, with the same clustered baseline. The omitted-size odds ratio ranged from 1.30 to 2.77 (median 2.01), significant in 38 of 40 runs. With size included it ranged from 0.84 to 1.78 (median 1.29), significant in 9. These counts are descriptive and imprecise. Seed 34 was chosen during development because it illustrates the intended patterns so its p-values are not an unbiased experiment. The upward bias from omitting size is repeatable; the exact “2×” is not.
So what?
The “2× odds” headline reflects confounding in this simulator, not a robust effect of SOC 2: the size-adjusted estimate is 1.28 (0.90 to 1.82), which is also compatible with a sizeable effect. The bank’s own model was built to describe associations, then reused to support a contract policy. The April 17, 2026 interagency Supervisory Guidance on Model Risk Management (Federal Reserve, FDIC, OCC) flags use beyond a model’s intended purpose (§IV, Model Use), and describes effective challenge (§III) and testing with alternative assumptions (§IV). The challenge here was one added variable. This is partial validation too; even a robust association would not be causal.
Show the code
score <-data.frame(Test =c("Calibration", "Forecast dominance", "Fragility"),Question =c("Honest probabilities?", "Beats a simple model?", "Robust headline?"),`Measured result`=c(sprintf("Raw top group predicted %s, observed %s. Isotonic overlay changes Brier by %s (%s to %s); gains small and unclear.",pct(raw_top$predicted), pct(raw_top$observed), sgn(brier_chg), sgn(cm$diff_low), sgn(cm$diff_high)),sprintf("MSE %s lower than the 12-month average; DM p = %s (n = 18): no detectable advantage.",pct(1- full$mse_vs / full$mse_naive, 0), pval(full$dm_p)),sprintf("Odds ratio %s becomes %s (p = %s) when vendor size is added; one added variable removes significance.",num(b$or), num(ps$or), num(ps$p))),`Suggested response`=c("Do not approve the tested overlay for routine use yet; investigate, keep the existing process under documented controls, validate any replacement on later outcomes.","Closer monitoring; raise with vendor; ask for development evidence; keep contingency plan.","Limit use: do not use this association alone to infer the effect of requiring SOC 2; document the exception."),check.names =FALSE)knitr::kable(score)
Table 1: Series scorecard: measured results at NorthPoint, and responses in the guidance’s vocabulary (measured result and decision kept separate).
Test
Question
Measured result
Suggested response
Calibration
Honest probabilities?
Raw top group predicted 10.8%, observed 6.9%. Isotonic overlay changes Brier by −0.00026 (−0.00064 to 0.00004); gains small and unclear.
Do not approve the tested overlay for routine use yet; investigate, keep the existing process under documented controls, validate any replacement on later outcomes.
Forecast dominance
Beats a simple model?
MSE 22% lower than the 12-month average; DM p = 0.235 (n = 18): no detectable advantage.
Closer monitoring; raise with vendor; ask for development evidence; keep contingency plan.
Fragility
Robust headline?
Odds ratio 2.04 becomes 1.28 (p = 0.16) when vendor size is added; one added variable removes significance.
Limit use: do not use this association alone to infer the effect of requiring SOC 2; document the exception.
How to read the table. One row per question: what we measured at NorthPoint, and the action sound practice suggests, in the guidance’s vocabulary. An overlay adjusts a model’s output without changing the model; limits on use restrict what a result may be used for.
What the table tells you. None of the three tests found anything clean, and none, alone, argues for scrapping VendorScore. The weakest item is the bank’s own finding.
Actionable Insights
Sound practice suggests documenting the SOC 2 finding as an exception (§VI) and analysing its new use before relying on it (§IV). Do not use this association alone to infer the effect of requiring SOC 2: contract requirements need business, legal and control evidence. The guidance does not prescribe this.
Footnotes
falsifyr 1.0.0: refit_model() performs each specification refit; attack() (term no_soc2, intensity “normal”, seed 34, kill rule p over alpha) ran 20 attacks: 19 survived, one unavailable. Its configured routine did not evaluate the added-control specification under our vendor-clustered inference rule, so we implemented that check separately.↩︎