Three Questions for Any Risk Model
Trust, but Verify: Validating a Vendor Risk Model You Can’t See Inside. A synthetic case study.
The decision problem
Your bank pays a vendor for a number. Every month, a model called VendorScore hands NorthPoint Bank a risk score for each of its 300 third-party vendors. Nobody at the bank can see the code, the training data, or the method. The scores arrive, and decisions follow.
How do you validate something you cannot open? This project shows how much can be learned from the scores and what happens afterwards, and where outside testing stops.
The three questions
The April 17, 2026 interagency Supervisory Guidance on Model Risk Management (Federal Reserve, FDIC, OCC) is explicitly non-prescriptive. We read it as describing sound practice, not rules. The three questions below are this project’s practical interpretation, not a regulator-prescribed checklist. Each works on any risk model.
Reading the § marks. § means “section.” Pages cite these parts of the guidance:
- §III, overview of model risk: what makes a model risky, how much a model matters (materiality), and independent critical review (“effective challenge”).
- §IV, development and use: how models are built and tested, and the risk of using a model for something it was not designed for.
- §V, validation and monitoring: checking a model against real outcomes, watching it over time, and adjusting, recalibrating or rebuilding it if needed.
- §VI, governance and controls: policies, roles and records, including documenting exceptions.
- §VII, vendor products: applying the same discipline to bought models whose code and data the bank may never see.
- Are its probabilities honest? When the model says 10%, do incidents happen about 10% of the time? This is calibration, tested with
probcal(Page 2). - Does it beat a simple model? A sophisticated model should outperform a plain 12-month average, and keep doing so when conditions change. This is forecast dominance, tested with
forecastdom(Page 3). - Would its headline finding survive a push? Some findings collapse under a small change of method or data. This is fragility, tested with
falsifyr(Page 4).
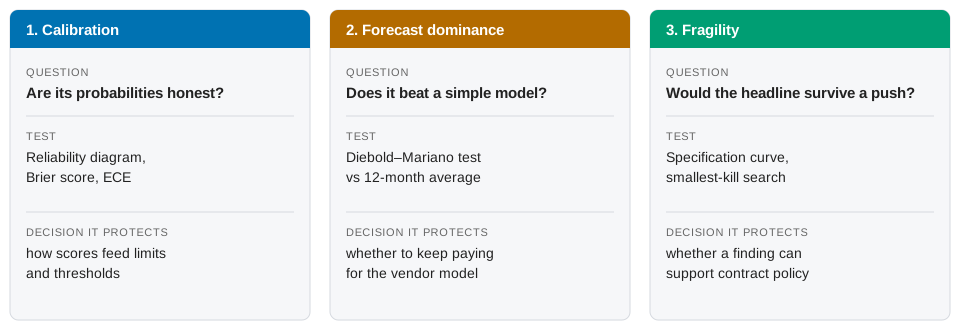
How to read the plot. Each of the three columns is one question. Reading down, each column shows the question, the test, and the decision it protects.
What the plot tells you. A model can pass one test and fail another, so one test alone leaves two decisions unprotected.
The case
NorthPoint Bank is a fictional regional bank with about $45 billion in assets. The guidance is expected to be most relevant to banks above $30 billion; some smaller banks may also find it relevant. Asset managers and fintechs fall outside its scope but can adopt similar practices voluntarily.
All pages share one synthetic dataset: 14,400 vendor-months (300 vendors over 48 months, January 2022 to December 2025), with 209 observed incidents, or 1.45% of vendor-months. Because the data are simulated, we know each vendor-month’s true incident probability, used only as a reference; the models never see it. Everything is reproducible from seed 34.
A fictional vendor, RiskMetric Systems, supplies VendorScore, trained on months 1 to 30. NorthPoint fits a recalibration overlay on months 31 to 36 and assesses it on months 37 to 48 (Page 2). Page 3 compares the raw scores with a benchmark over months 31 to 48, a period that includes a deterioration in vendors’ patching speed after month 36.
The black-box problem
Guidance on vendor products (§VII) recognises that a bank may lack access to a vendor model’s inner workings. The vendor’s summary offers only “ensemble machine learning on proprietary threat intelligence,” an AUC of 0.81 “on vendor development data,” and the assertion that scores are “well-calibrated.”
The bank can evaluate how the scores perform on its own outcomes, for calibration and discrimination. It cannot reproduce the vendor’s development-data AUC or inspect the hidden development choices. Testing scores against outcomes is partial validation only: it cannot confirm that the proprietary model is conceptually sound. That depends on what the vendor discloses (§VII).
How to read this project
Pages 2 to 4 share one structure: the question, the method in brief, the findings, what they mean for the bank, and one committee action phrased as “sound practice suggests…”. The expected findings were written as hypotheses before any analysis ran; where a result differs, the text reports the result. Code is folded by default. Page 4 closes with a scorecard of measured results; a final page covers reproducibility and limits.